Bolton Global is a leader in successful transitions to the independent business model. We provide domestic and international advisors with the full range of capabilities to power their business to the next level and substantially improve compensation.
Platform Benefits
Grow your International Business and your Net Worth
Benefits of Partnering with Bolton Global
INDUSTRY’S TOP PAYOUT
Financial advisors can receive up to 95% payout on fees and commissions net of clearing and manager costs with no separate platform fees. Clients can choose between a commission or a fee-based relationship depending upon whichever option is in the client’s best interest. Advisors who transition from the major banks and wirehouses can more than double their pre-tax income after expenses by converting to the independent business model through Bolton.
FREEDOM TO OPEN ACCOUNTS WORLDWIDE WITHOUT THE HIGH MINIMUMS
Many major banks and wirehouses significantly restrict the number of countries where residents or passport holders are allowed to open accounts. In addition, residents of some countries may be required to maintain a minimum balance of $1-5 million to establish an account. Bolton and BNY Mellon Pershing accept accounts for the passport holders of most countries subject to AML and KYC due diligence. There is no minimum size threshold to open or maintain an account.
FINANCIAL INSTITUTION STRENGTH
AND STABILITY
Clients have the peace of mind that custody of their accounts is held through BNY Mellon Pershing, a wholly owned subsidiary of the Bank of New York Mellon. BNY Mellon is the oldest US banking concern founded by Alexander Hamilton in 1784 and is ranked by Moody’s among the safest large US banks with over $45 trillion in assets under custody and administration. BNY Mellon Pershing, founded in 1939, is the world’s largest correspondent clearing and custody firm with $2.0 trillion in client assets and $2.0 billion in net capital.
OWNERSHIP OF YOUR BOOK OF BUSINESS
Financial advisors can fully capture the equity in their book and monetize its value when they retire through Bolton’s independent business model. Depending on the characteristics of the business, an investment practice can be merged or sold for 2 to 3 times revenue. At most major banks and wirehouses, advisors receive a tiny fraction of this amount when they retire. Bolton provides you with the support you need to operate as an independent business including brand and logo development, customized website tailored to your message, branded account statements, marketing materials as well implementation of technology platforms and business structures.
Superior International Wealth Management Capabilities
Bolton Global provides advisors with the full range of capabilities to compete with the major banks for both domestic and international client business.
Access to all Major Global Exchanges and Currencies
We offer institutional and retail clients multicurrency execution capabilities in over 65 exchanges. Clients can buy and sell global fixed income securities and non-U.S. dollar-denominated bonds assisted by our expertise and local market experience in Central and South America, Europe and Asia. As we conduct all fixed income business on an agency only basis, our clients can take advantage of the best available pricing through our broad network of counter party bond dealers and can execute their trades in nearly 50 currencies.
Broad Coverage of Offshore Mutual Fund Products and UCITs
For international clients, our platform offers more than 4,000 offshore mutual funds with multiple share classes for each strategy. These vehicles provide tax advantages available only to non-US citizens. Foreign clients can use these investment products to achieve broad portfolio diversification across assets classes, foreign and domestic markets as well as currencies.
Multi-Currency Holding and Reporting
Clients can hold cash positions in their investment accounts in over 50 foreign currencies and can receive monthly account statements of assets expressed as a value in both US and in foreign currencies. These multi-currency statements are available on a household basis where all of the client’s accounts are reported both at the account level and on a consolidated basis.
Fully Digital and Paperless Account Opening and Maintenance
Financial Advisors and their clients can open and maintain accounts on a paperless basis in a fully secure environment. This eliminates the need to print, scan and/or photograph account documents which require client signature, resulting in an effective and efficient account opening process. In addition, advisors are allowed to communicate with clients through WhatsApp.
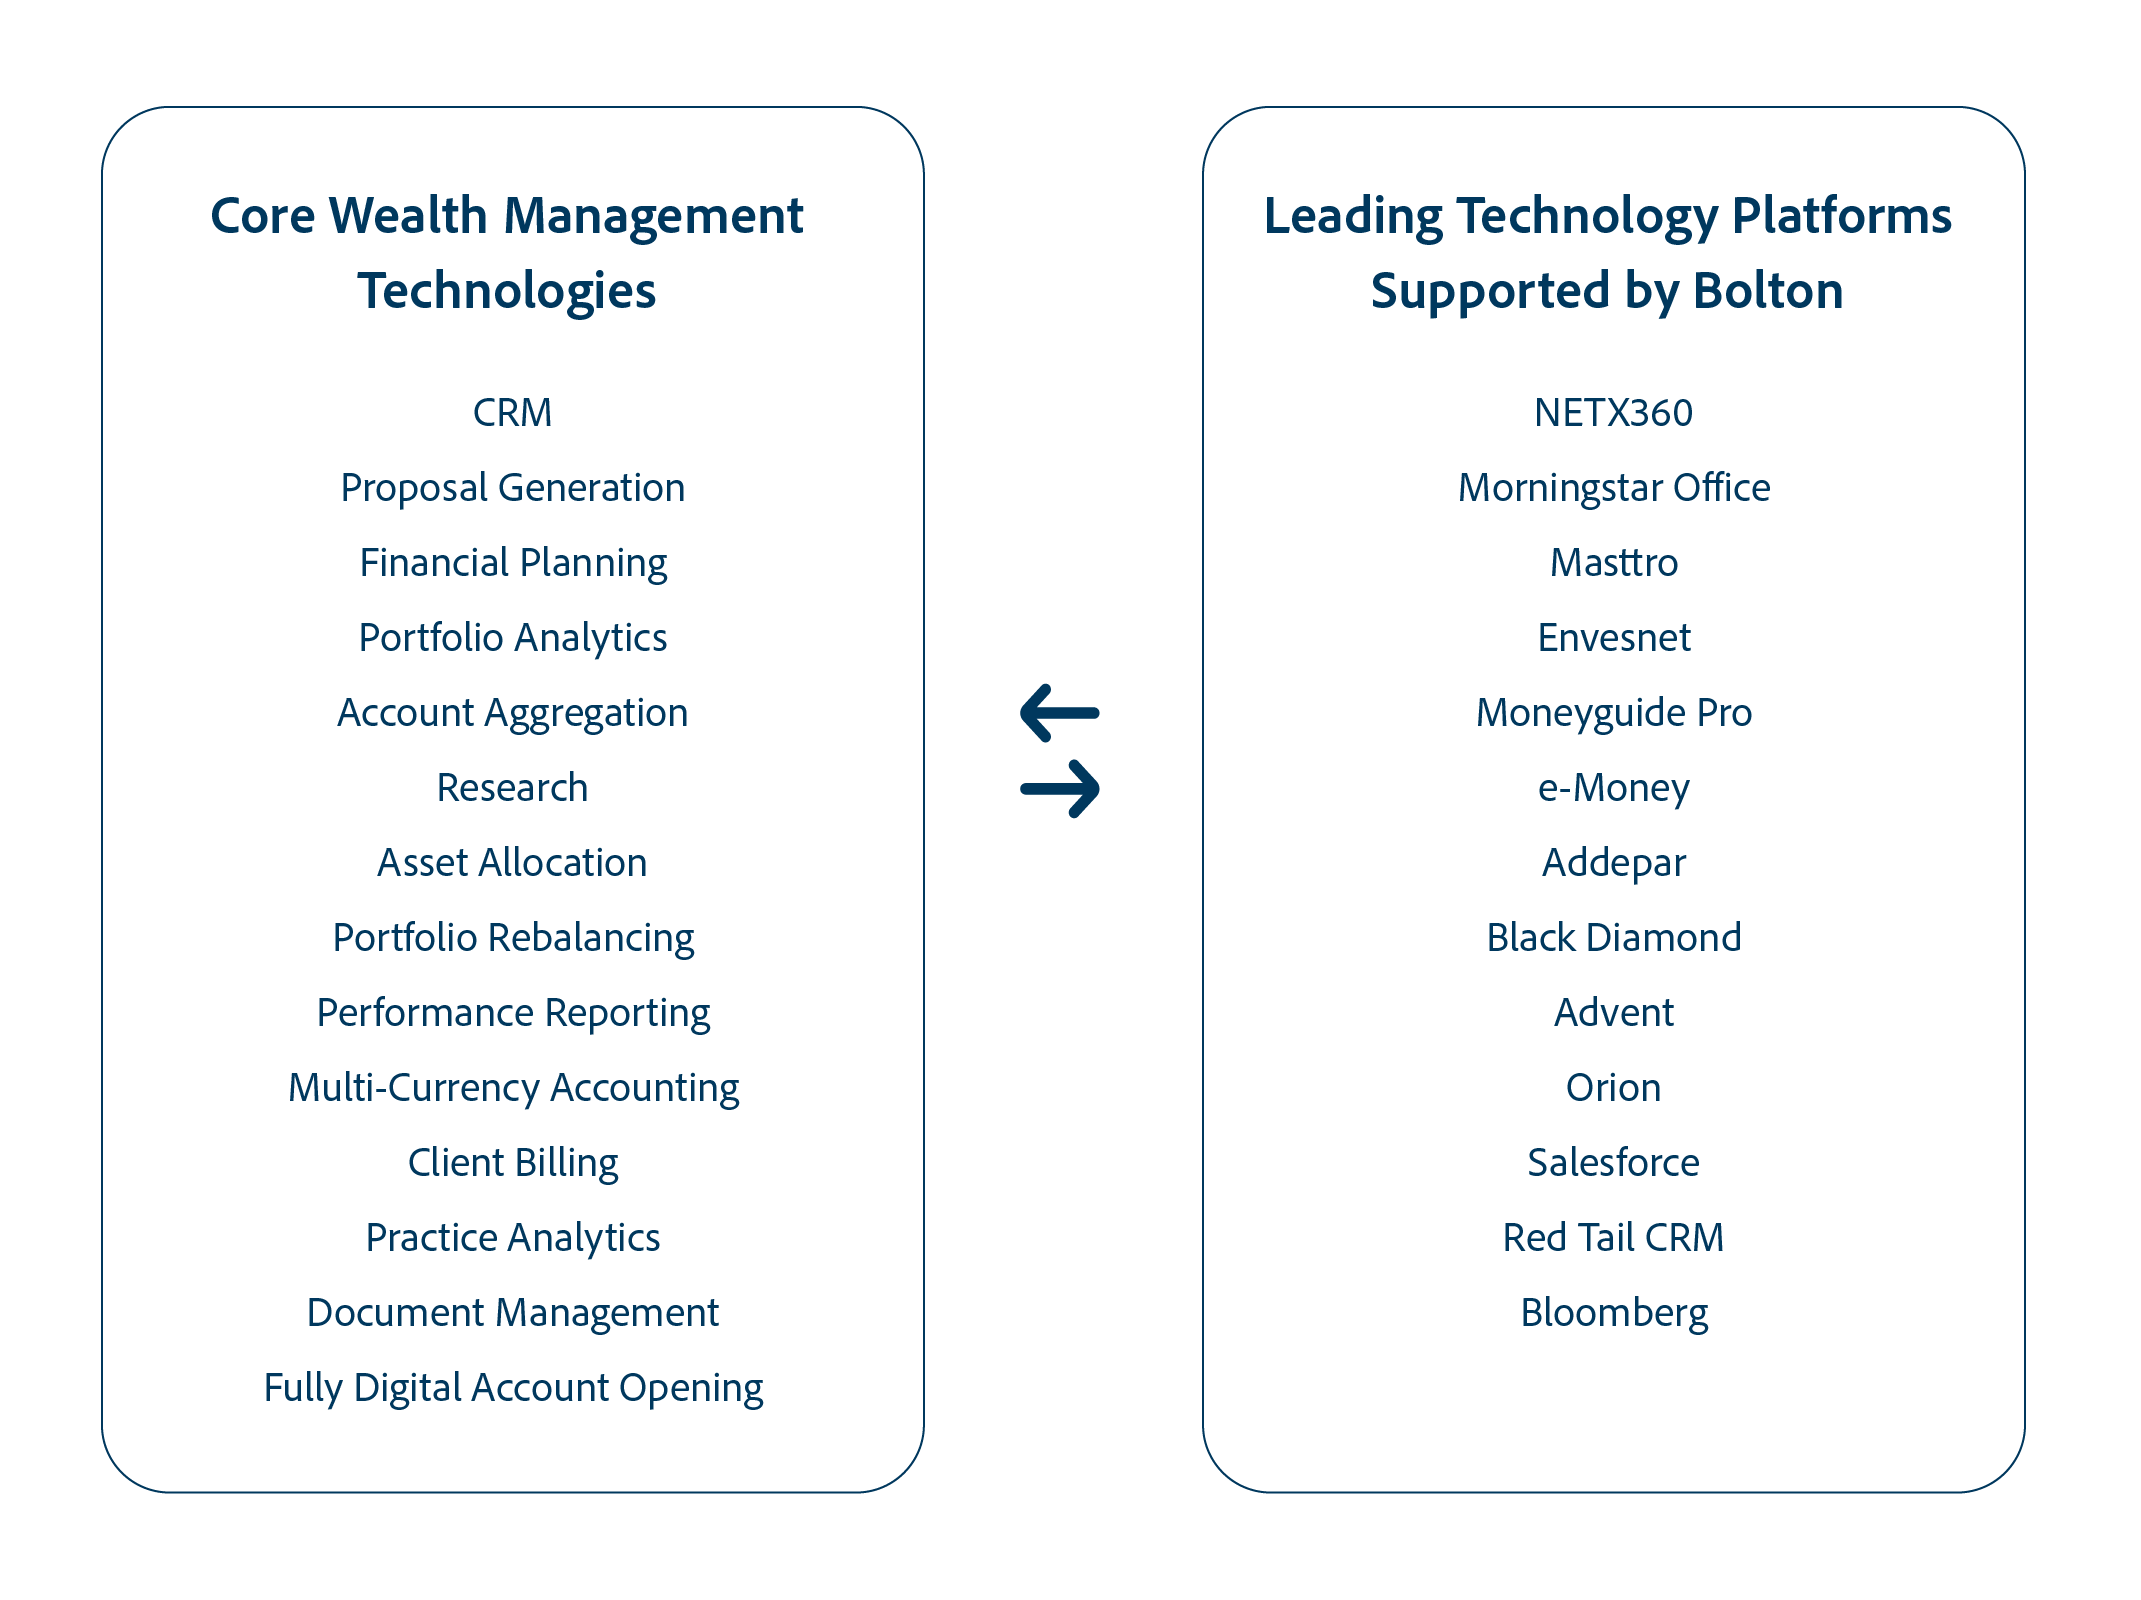
BEST-IN-CLASS TECHNOLOGIES
With BNY Mellon-Pershing’s open architecture, advisors have access to the industry’s leading wealth management technologies to support every aspect of their business. These include “all-in-one” platforms which incorporate multiple functions to specialized systems that address a specific data capture or reporting requirement of your business.
INDEPENDENT BUSINESS MODEL
Efficient Transition to Independence
Bolton Global is an industry leader in transitioning advisors from the major banks to the independent business model. More than three-fourths of our affiliated advisors have transitioned from Morgan Stanley, Merrill Lynch, Wells Fargo and JP Morgan. We have expertise in transitioning major teams from both non-protocol and protocol member firms.
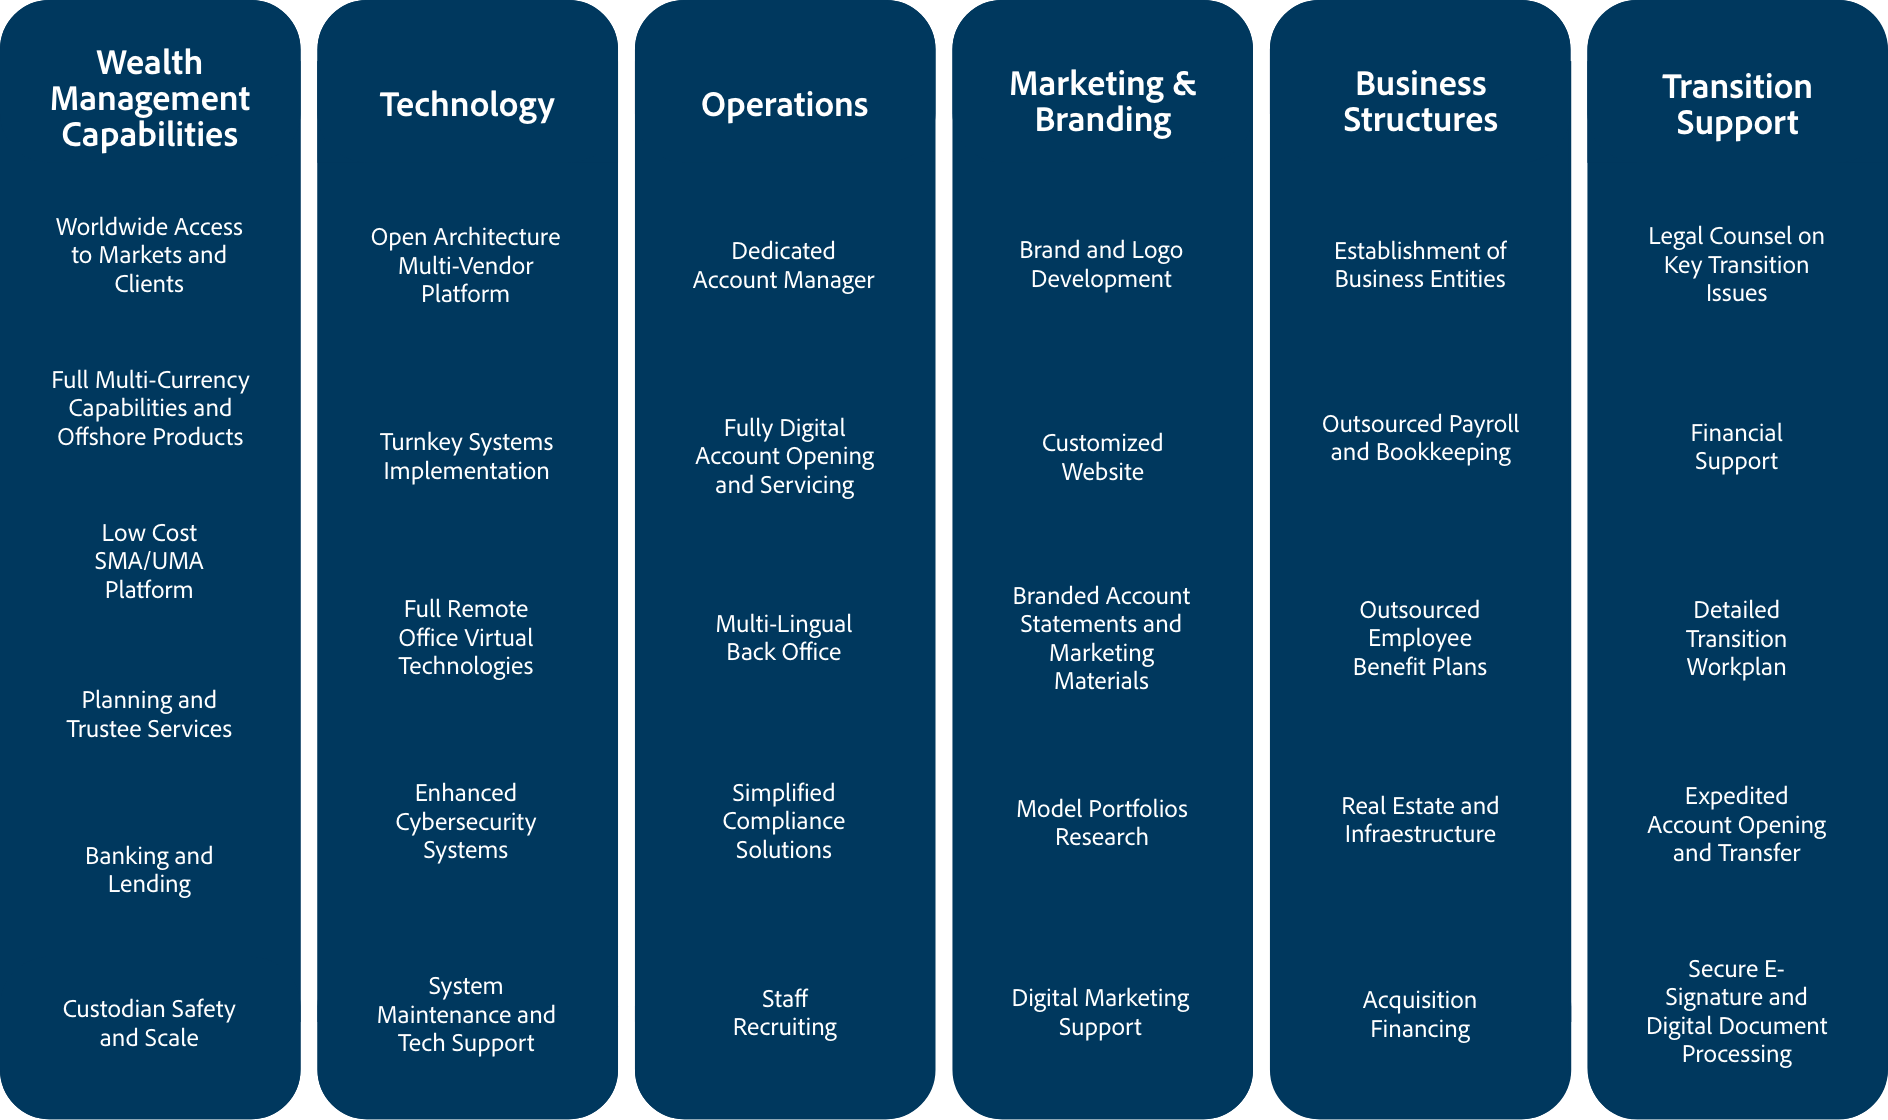
Our transition team deploys a disciplined step by step approach with the goal of transferring 100% your book of business. Bolton’s platform includes these key components to ensure a successful transition to independence:
Key Components of Successful Transition to Independence
Bolton Global Capital, established in 1985, is FINRA member firm with an affiliated SEC registered investment advisor. The firm manages approximately $13 billion in client assets through independent financial advisors located in affiliated offices across the US, Latin America and Europe.